Category
AI Strategy Roadmap Alignment: Four Columns, One Slide
Last updated: June 2026
By David Brennan · Arkeo AI · Building and Deploying Custom AI agents since 2023
An AI roadmap that is not aligned to business objectives is a technology calendar. It tells you when things will be built. It does not tell you whether the things being built connect to the outcomes the business is measured on.
Alignment is not a values exercise. It is a structural problem. The roadmap needs four specific connections to the business plan, and each connection requires a named person and a written deliverable. Here is how to build those connections and verify they are real rather than assumed.
Quick Answer
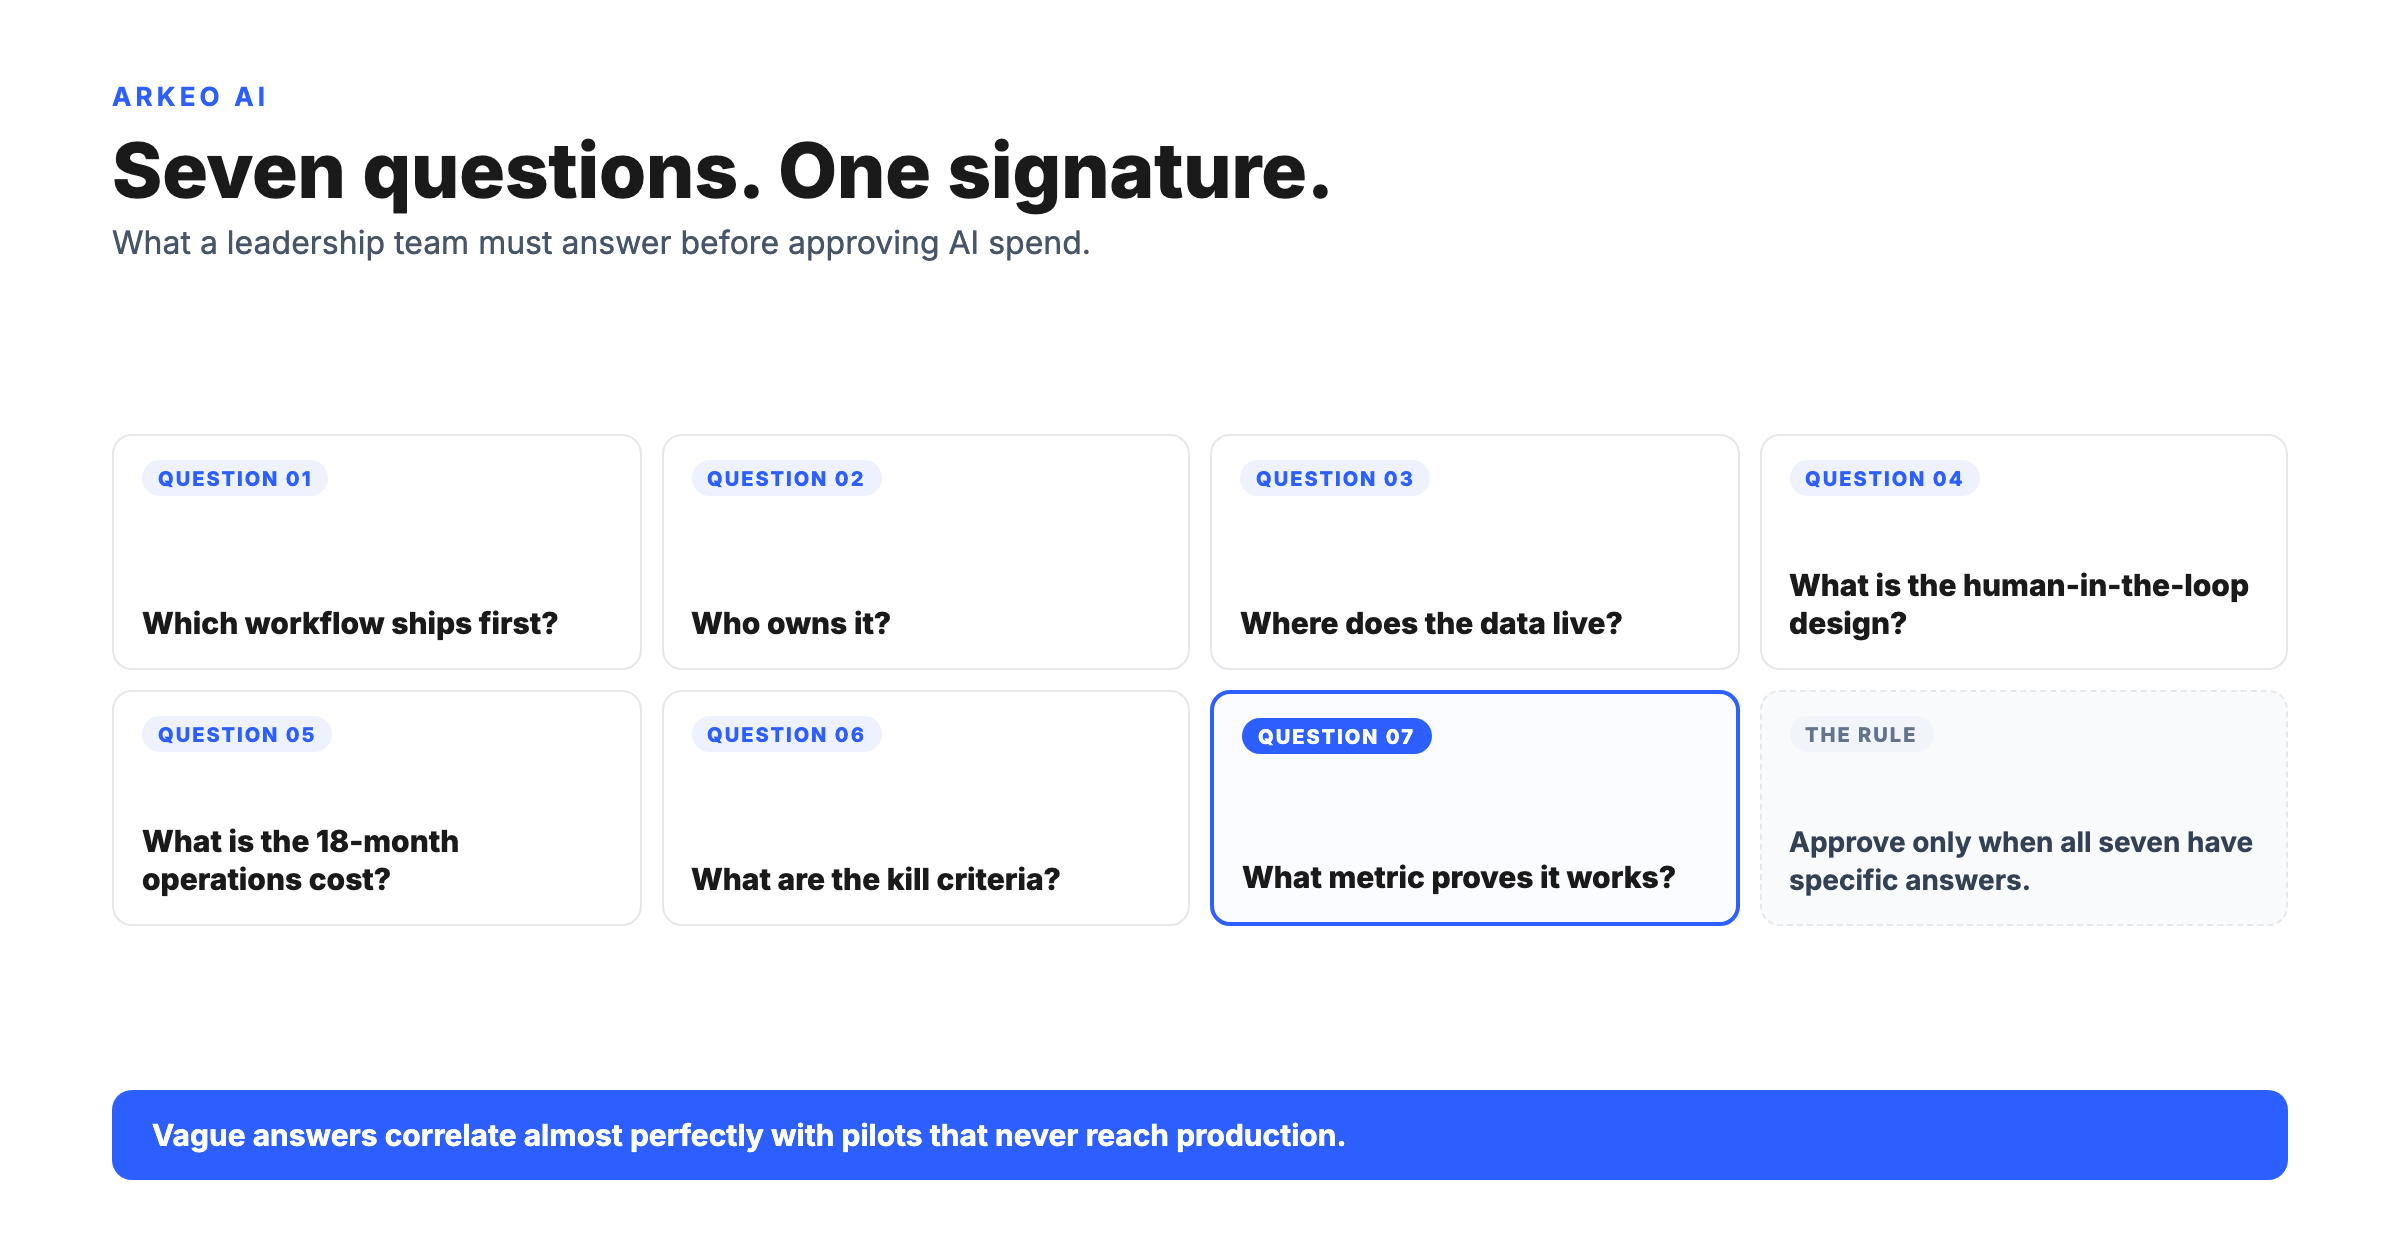
The four alignment connections: Metric link (each workflow maps to a board-level KPI). Budget lock (the roadmap cost is in the approved budget, not a request). Owner confirmation (the executive owner of the roadmap is named and aware). Review cadence (the roadmap is reviewed by the executive team at a fixed interval, not ad hoc).
Why it matters: BCG found 74 percent of companies struggling to capture AI value. In most cases the roadmap existed. The alignment connections did not.
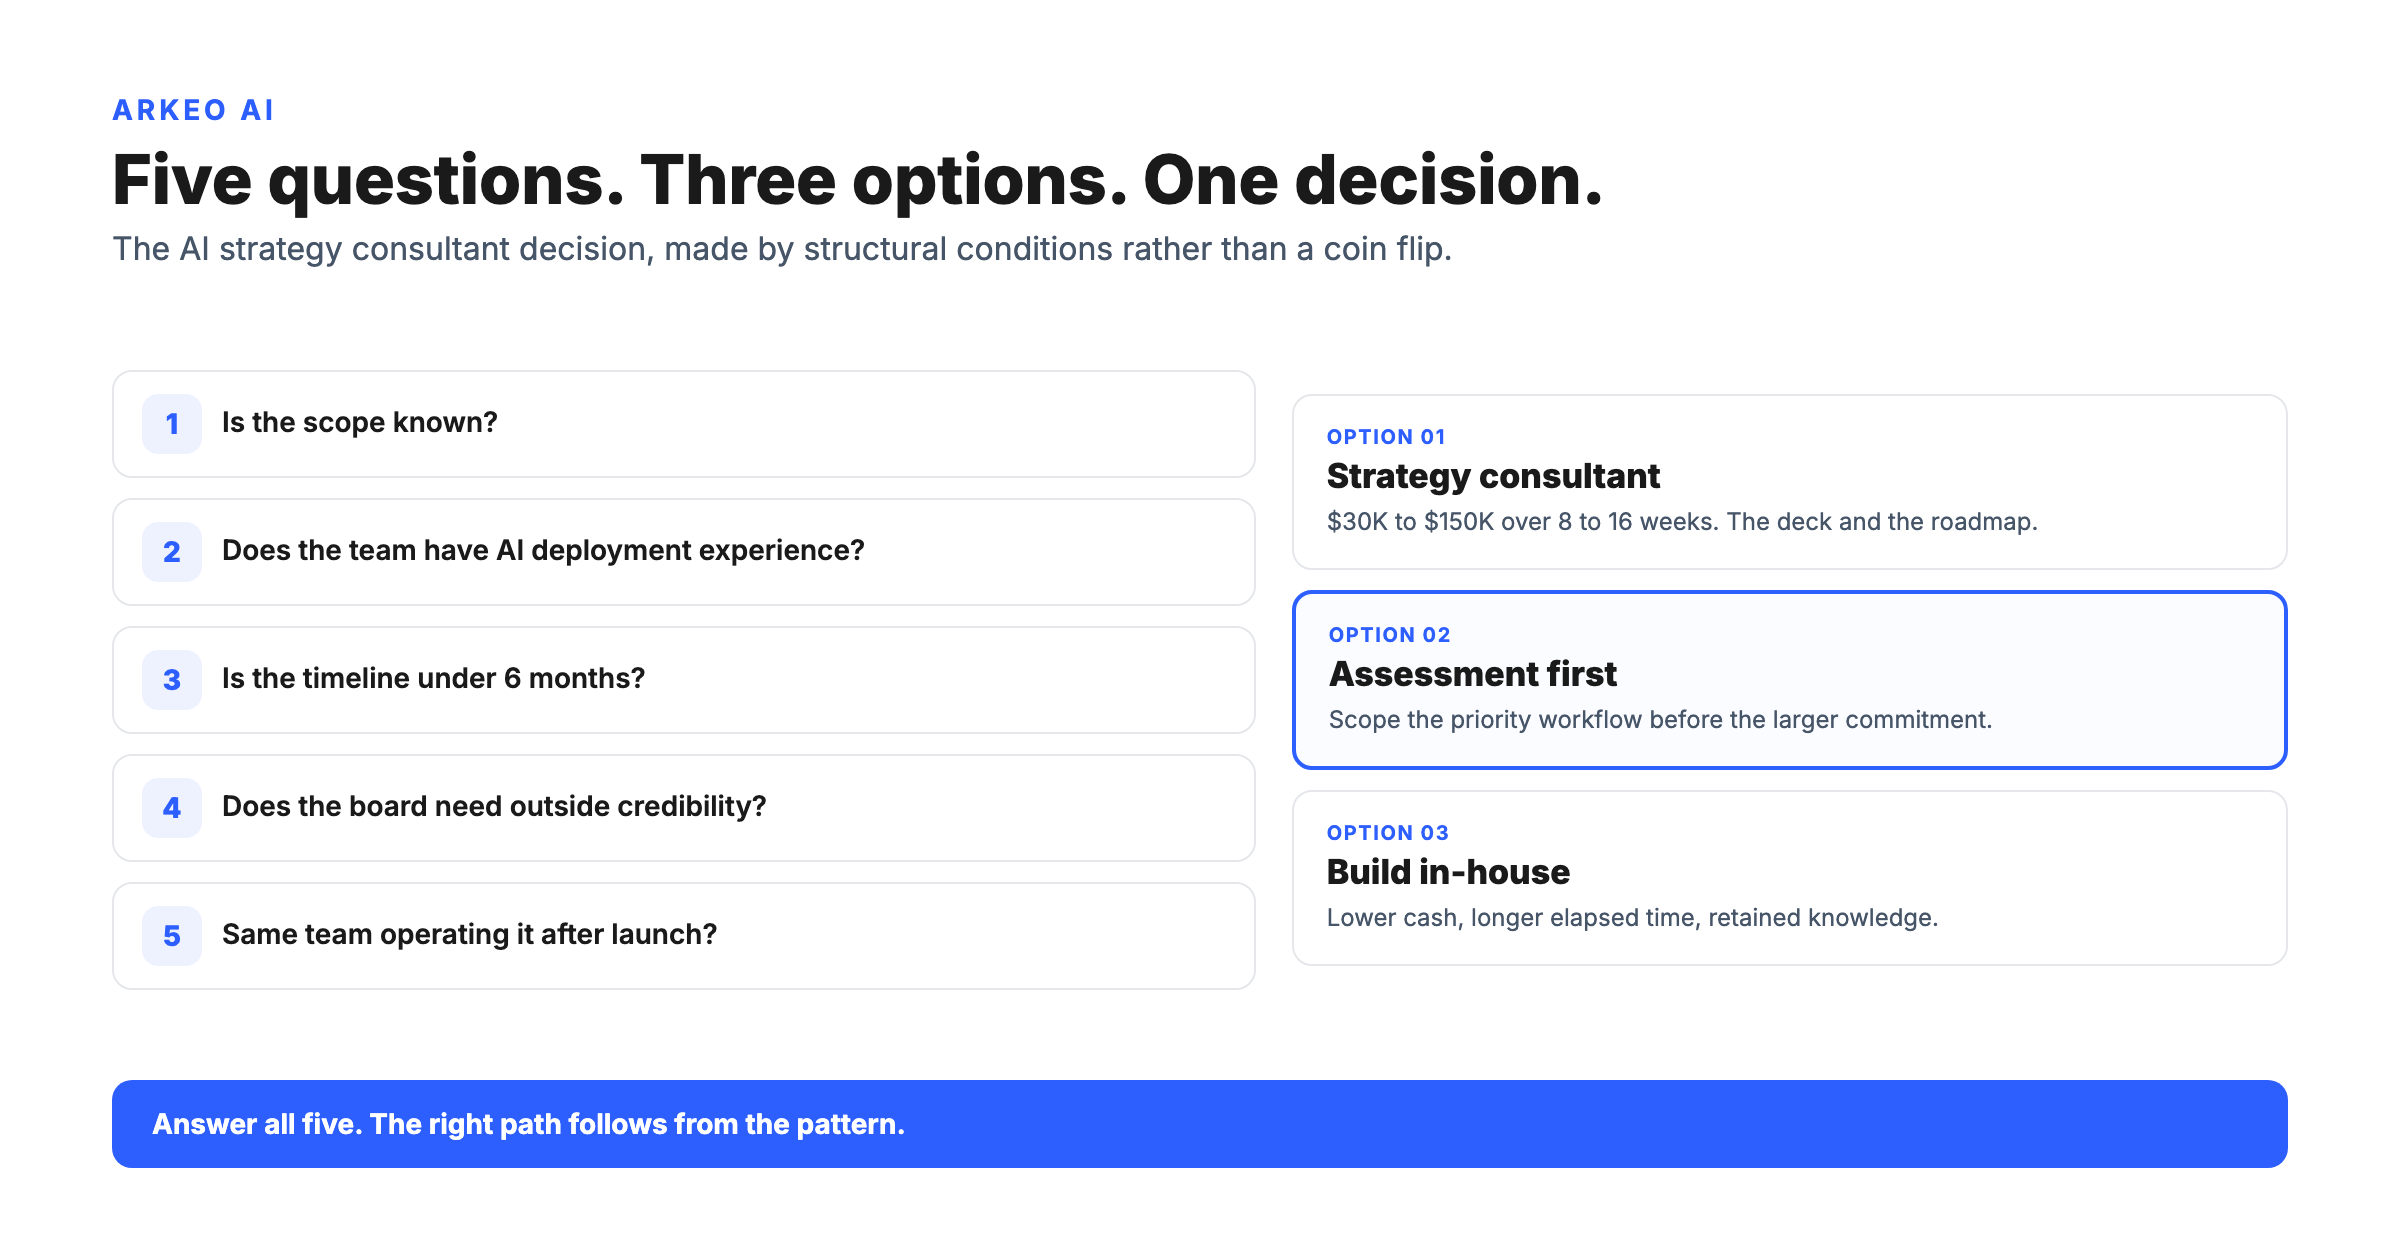
Next step: The free AI Assessment maps the workflow shortlist directly to current business objectives and produces the first alignment connection before the build starts.
The free AI Assessment maps your top workflow candidates to your current business objectives and produces the metric-link connection before the build starts. You leave with a roadmap that has a board-level anchor, not a technology calendar.
Book Your Free AI Assessment →THE 4 ALIGNMENT CONNECTIONS
Metric link
Each workflow maps to a board-level KPI. Written as a one-sentence statement before the build starts.
Budget lock
Roadmap cost is in the approved budget, not a future request. Signed by the person controlling capital allocation.
Owner confirmation
Both owners named, briefed, and confirmed in writing before the build starts.
Review cadence
Monthly for Q1–Q2 after first deployment, quarterly thereafter. Fixed calendar entry, not ad hoc.
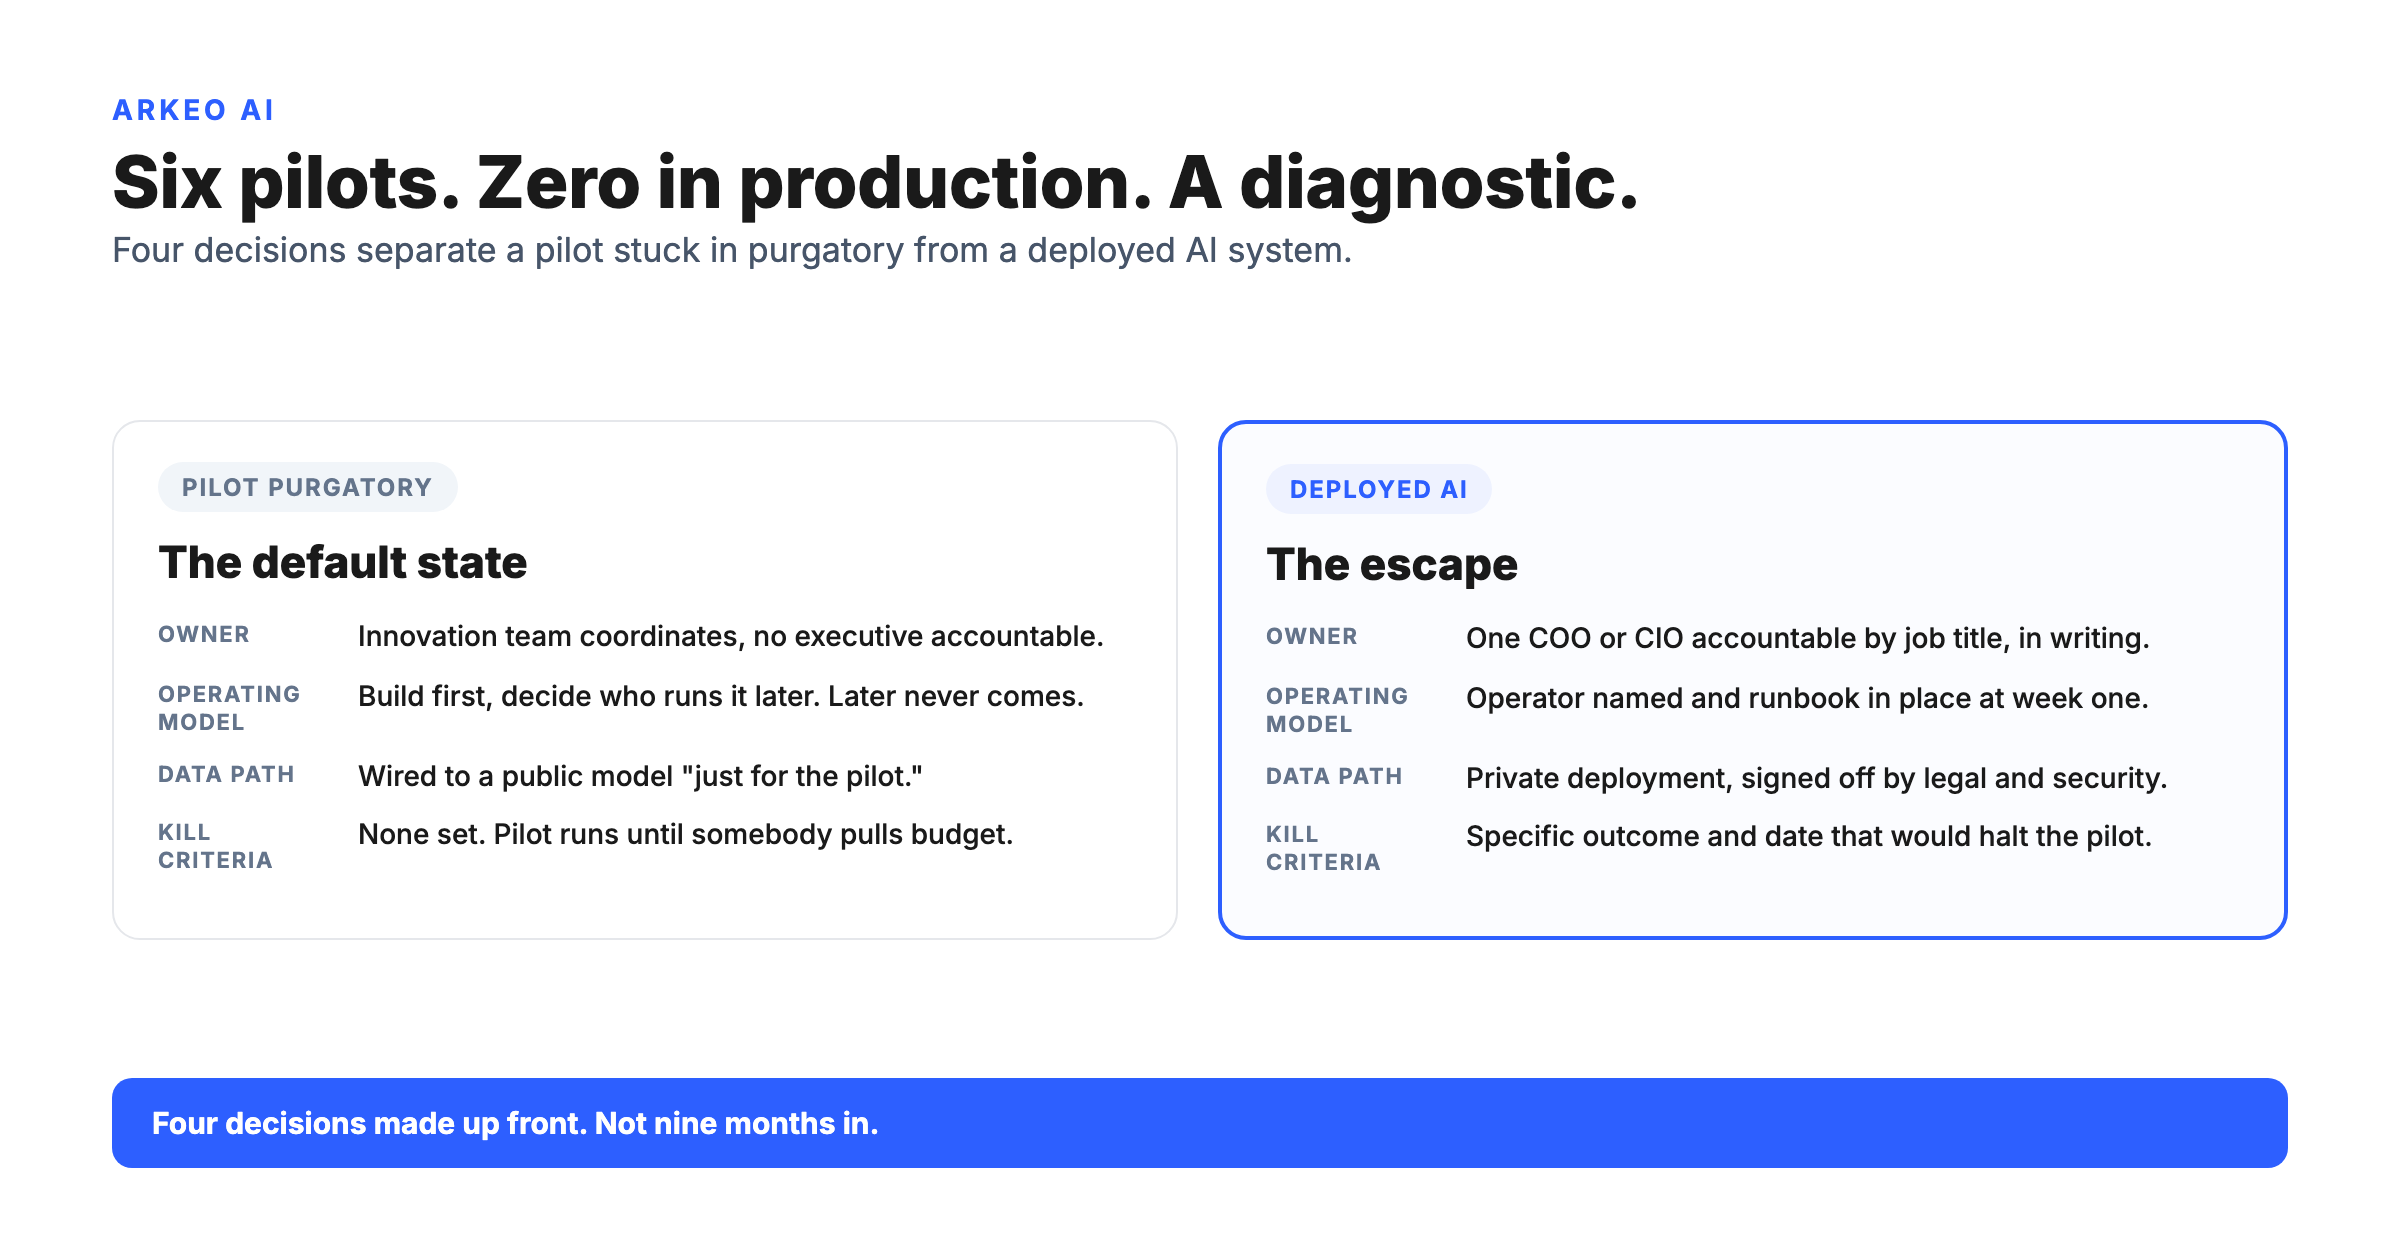
What alignment failure looks like in practice
A business builds an AI agent for document summarization. The agent works. Override rate is under 5 percent. The workflow is faster. The team runs it every day.
Twelve months later, the CFO asks what AI has contributed to revenue or cost structure. The answer is "our team saves about two hours per document." The CFO asks how that maps to margin. No one knows, because the document summarization workflow was not connected to a board-level metric when it was built. It was connected to a process pain point. The pain point was real. The metric connection was never made.
That is alignment failure. The agent deployed. The business cannot explain its value to the people who approved the budget.
The 12-month AI roadmap guide covers the full timeline structure. The AI strategy framework covers the components the roadmap is built around. This article is specifically about the four connections that make the roadmap legible to the executive team rather than just the build team.
Connection 1: Metric link
Every workflow on the roadmap must map to at least one board-level metric. Not a team metric. Not a process metric. A metric the CFO or CEO reports externally or reviews in monthly management accounts.
The mapping is not always direct. Document summarization maps to labor cost per document, which maps to gross margin if services are labor-intensive enough. Invoice matching maps to days payable outstanding, which maps to cash conversion cycle. The connection exists. It needs to be written down before the build starts, not inferred after the deployment.
The format is a one-sentence statement per workflow: "This workflow reduces [metric] by an estimated [X percent] over [timeframe], based on [current volume] and [current unit cost]." If you cannot write that sentence, the metric link does not exist yet.
The operator test: Take the top three workflows on your roadmap. Can you write the one-sentence metric-link statement for each? If any sentence requires an assumption about a number that is not in your current management accounts, that is a gap to close before the workflow enters the build phase.
Connection 2: Budget lock
A roadmap cost that is in a budget request is not a budget lock. A roadmap cost that is in the approved budget, signed by the person who controls capital allocation, is a budget lock.
The distinction matters because a budget request can be deferred, repriced, or redirected to a different initiative during the next planning cycle. A budget lock cannot be moved without an explicit decision by the person who approved it. That explicit decision creates a paper trail. The paper trail creates accountability.
A scoped single-workflow agent runs $15,000 to $40,000 on a cloud path and $20,000 to $50,000 on a private path. A 12-month roadmap with three workflows in production and the fourth in build runs $80,000 to $160,000 depending on complexity and data-path decisions. That number should be in the approved budget line, not in a future planning request. If it is not, the roadmap is aspirational rather than funded.
The AI consultant vs. internal build comparison covers the full cost structure. The budget lock connection requires that the approved budget matches the cost model in that analysis.
Connection 3: Owner confirmation
The owner registry in the AI strategy plan template names two people: the executive owner (budget and escalation authority) and the operational owner (runs the workflow on Monday morning). Owner confirmation means both people know they are named, have been briefed on what ownership means, and have confirmed in writing.
The reason this needs to be explicit is that executive owners frequently discover they are named after the build starts. The discovery creates a re-scoping conversation that costs two to four weeks. The build team assumed the executive was aware. The executive assumed someone would brief them. Neither assumption was tested in writing.
Owner confirmation is one email with three pieces of information: the workflow name, the owner's responsibilities (budget approval authority, monthly review attendance, escalation response within 24 hours), and a reply confirming receipt. It takes five minutes. The absence of that email has extended builds by weeks in every case where it was skipped.
The operator test: For each workflow on the roadmap, can you point to the email where the executive owner confirmed their role? If not, owner confirmation is incomplete for that workflow.
Connection 4: Review cadence
An AI roadmap reviewed ad hoc is not reviewed. Ad hoc means reviewed when something goes wrong. Reviews that occur only when something goes wrong are reactive rather than corrective. They address the symptom (the thing that went wrong) rather than the structural issue (why the override rate drifted or why the metric link is not showing up in management accounts).
The review cadence is simple: monthly for the first two quarters (while the first workflow is in production), quarterly thereafter. The monthly review has four items: override rate for each deployed workflow, metric-link actuals vs. estimates, budget actuals vs. plan, and next workflow readiness (is the brief complete for the second workflow). Each review takes 30 minutes with the executive owner. The output is a one-page update to the roadmap document.
IBM's 2025 AI adoption data found 54 percent of enterprises citing AI governance as a primary adoption barrier. The review cadence is the governance structure for the roadmap. Without it, the roadmap is a plan with no feedback loop. With it, the roadmap is a living document that surfaces structural problems early enough to fix them within the same budget cycle.
Misaligned Roadmap
- ✗ Workflows connected to process pain, not board KPIs
- ✗ Budget in next planning request, not approved line
- ✗ Executive owner learns their role after build starts
- ✗ Reviews happen only when something goes wrong
Aligned Roadmap
- ✓ One-sentence metric-link per workflow, written before build
- ✓ Roadmap cost in approved budget, signed by capital owner
- ✓ Both owners confirmed in writing before build starts
- ✓ Monthly reviews in Q1–Q2, calendar entry exists
What a fully aligned roadmap looks like
66%
of AI agent adopters reported measurable productivity gains — the shared characteristic was alignment before build start
Source: PwC AI Agent Survey
74%
of companies struggle to capture AI value — in most cases the roadmap existed, the alignment connections did not
Source: BCG AI Value Study
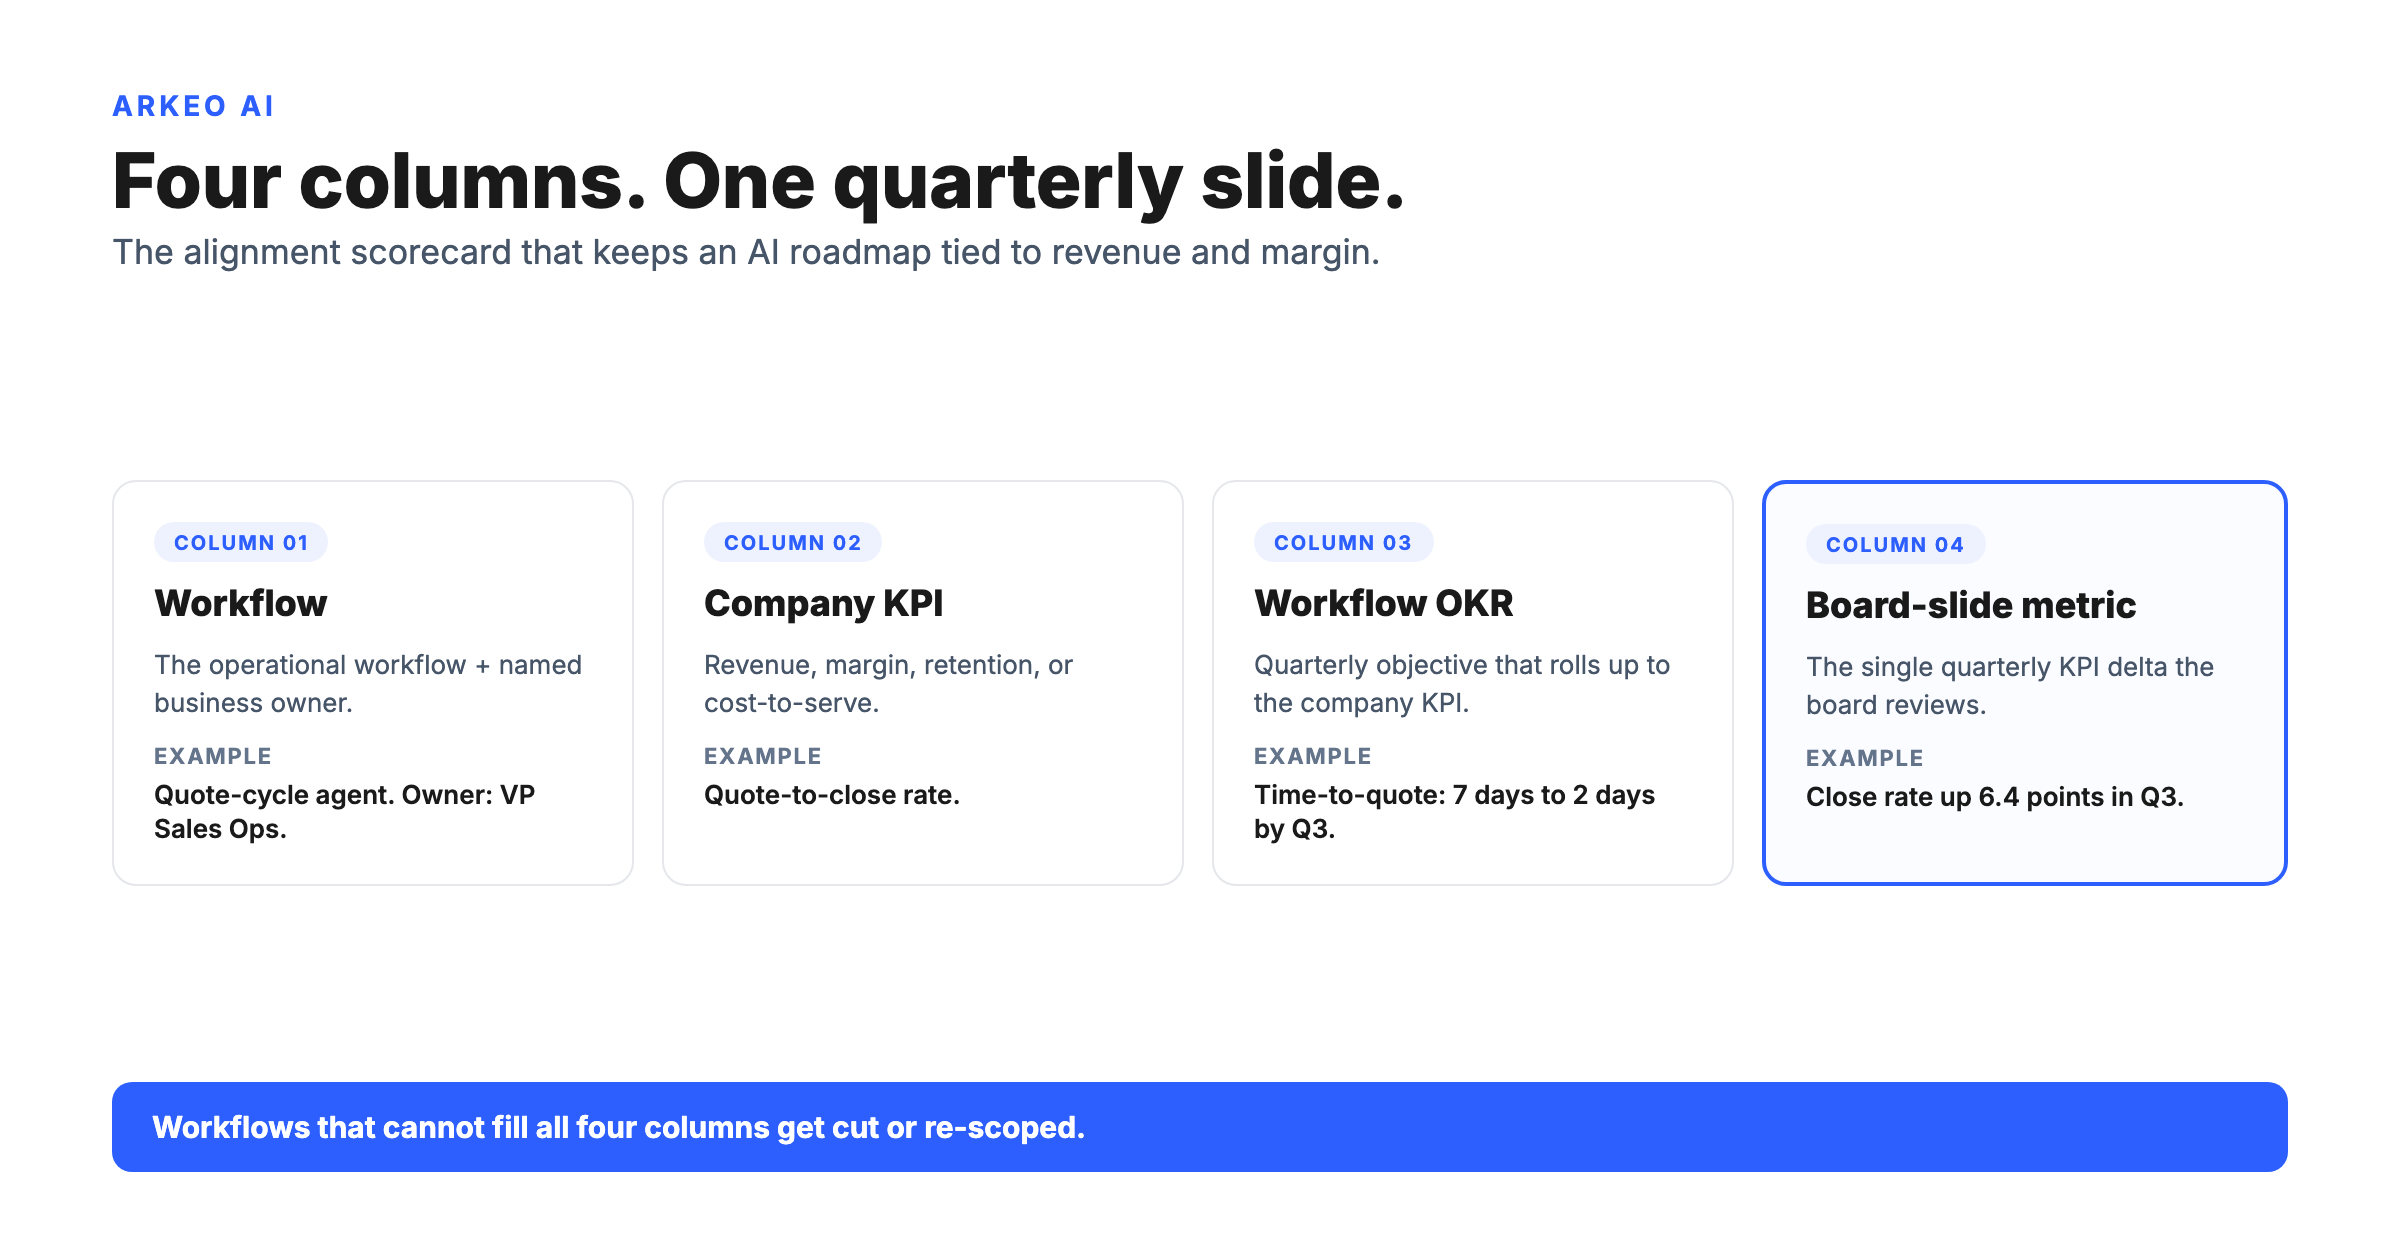
A fully aligned roadmap has these four elements documented in writing: a one-sentence metric-link statement for each workflow, a budget line in the approved budget matching the roadmap cost model, a confirmation email from both owners of each workflow, and a calendar entry for monthly reviews in Q1 and Q2 and quarterly reviews thereafter.
None of the four elements require a consultant, a framework, or a transformation program. They require the willingness to close four specific gaps before the build starts rather than discovering them during the post-deployment board review.
The businesses that show measurable AI results at the end of year one are not the ones with the most sophisticated roadmaps. They are the ones with the most rigorously aligned ones. The PwC AI Agent Survey found 66 percent of agent adopters reporting measurable productivity gains. The characteristic shared by those operators is alignment: each deployment had a metric, a budget, an owner, and a review schedule before the build started.
The free AI Assessment maps your workflow candidates to current business objectives and produces the metric-link statement for each. You leave with the first alignment connection in writing and the roadmap anchored to a board-level KPI.
Book Your Free AI Assessment →Frequently Asked Questions
The free AI Assessment maps your workflow candidates to your current business objectives and writes the metric-link statement for each. You leave with connection one complete and the build team able to point to a board-level KPI from day one.
Book Your Free AI Assessment →